Back to all Blog Posts

Ensemble Methods in Machine Learning: Bagging & Subagging

  • Coding
  • Python
  • Statistics & Methods
25 January 2019
·

Team statworx

In this blog, we will explore the Bagging algorithm and a computational more efficient variant thereof, Subagging. With minor modifications, these algorithms are also known as Random Forest and are widely applied here at STATWORX, in industry and academia.

Almost all statistical prediction and learning problems encounter a bias-variance tradeoff. This is particularly pronounced for so-called unstable predictors. While yielding low biased estimates due to flexible adaption to the data, those kind of predictors react very sensitive to small changes in the underlying dataset and have hence high variance. A common example are Regression Tree predictors.

Bagging bypasses this tradeoff by reducing the variance of the unstable predictor while leaving its bias mostly unaffected.

Method

In particular, Bagging uses repeated bootstrap sampling to construct multiple versions of the same prediction model (e.g. Regression Trees) and averages over the resulting predictions.

Let's see how Bagging works in detail:

  1. Construct a bootstrap sample (yi,mathbfxi):(i=1,dots,n)(y_{i}^{*}, mathbf{x_{i}^{*}}) :(i = 1, dots , n) (with replacement) of the original i.i.d. data at hand (yi,mathbfxi):(i=1,dots,n) (y_{i}, mathbf{x_{i}}) : (i = 1, dots , n).
  2. Fit a Regression Tree to the bootstrap sample - we will denote the tree predictor by hatthetan(mathbfx)hat{theta}_{n}^{*}(mathbf{x}).
  3. Repeat Steps one and two BB many times and calculate frac1Bsumb=1Bhatthetan,b(mathbfx) frac{1}{B}sum_{b=1}^{B}hat{theta}_{n, b}^{*}(mathbf{x}) .

OK - so let us take a glimpse into the construction phase: We draw in total BB different bootstrap samples simultaneously from the original data. Then to each of those samples, a tree is fitted and the (in-sample) fitted values are averaged in Step 3 yielding the Bagged predictor.

The variance-reduction happens in Step 3. To see this, consider the following toy example.

Let X1,dots,XnX_1, dots, X_n be i.i.d. random variables with mu=E[X1]mu = E[X_1] and sigma2=Var[X1]sigma^2 = Var[X_1] and let barX=frac1nsumi=1nXibar{X}= frac{1}{n}sum_{i=1}^{n}X_{i}. Easy re-formulations show that

  • Var[barX]=fracsigma2nleqsigma2Var[bar{X}]=frac{sigma^2}{n} leq sigma^2
  • E[barX]=muE[bar{X}]=mu

We observe that indeed the variance of the mean is weakly smaller than for the individual random variables while the sample mean is unbiased.

It is widely discussed in the literature why Bagging works and it remains an open research question. Bühlmann and Yu (2002) propose a subsampling variant of Bagging, called Subagging, which is more traceable from a theoretical point of view.

In particular, Bühlmann and Yu (2002) replace the bootstrap procedure of Bagging by subsampling without replacement. Essentially, we are only changing Step 1 of our Bagging algorithm by randomly drawing mm times without replacement from our original data with m < n and get hence a subset of size mm. With this variant at hand, it is possible to state upper bounds for the variance and mean squared error of the predictor given an appropriate choice of the subsample size mm.

Simulation Set-Up

As the theory is a little bit cumbersome and involves knowledge in real analysis, we simulate the main findings of Bühlmann and Yu (2002).

Let's compare the mean-squared prediction error (MSPE) of the Regression Tree, Bagged and Subagged predictor and illustrate the theory part a little bit more.

In order to do this, we consider the following model
yi=f(mathbfxi)+epsiloniy_{i} = f(mathbf{x}_{i}) + epsilon_{i}

where f(mathbfxi)f(mathbf{x}_{i}) is the regression function, mathbfxisimU10[0,1] mathbf{x}_{i} sim U^{10}[0,1] is the design matrix generated from a uniform distribution and epsilonisimN(0,1)epsilon_{i}sim N(0,1) is the error term (foralli=1,dots,nforall i = 1, dots, n).

For the true data-generating process (DGP), we consider the following model which is quite frequently used in the machine learning literature and termed "Friedman #1"-model:

f(mathbfx)=10sin(pix(1)x(2))+20(x(3)frac12)2+10x(4)+5x(5)f(mathbf{x}) = 10 sin(pi x^{(1)} x^{(2)}) + 20(x^{(3)} - frac{1}{2})^{2} + 10 x^{(4)} + 5 x^{(5)}

where mathbfx(j) mathbf{x}^{(j)} is the jj-th column of the design matrix mathbfx mathbf{x} (for 1leqjleq101 leq j leq 10).

As you can see, this model is highly non-linear - Regression Tree models shall therefore be appropriate to approximate our DGP.

To evaluate the prediction performance of Bagging and Subagging predictors we conduct a Monte Carlo simulation in Python.

We first import the relevant packages.

<span class="hljs-keyword"><span class="hljs-keyword">import</span></span> numpy <span class="hljs-keyword"><span class="hljs-keyword">as</span></span> np
<span class="hljs-keyword"><span class="hljs-keyword">import</span></span> sklearn.model_selection
<span class="hljs-keyword"><span class="hljs-keyword">import</span></span> sklearn.ensemble
<span class="hljs-keyword"><span class="hljs-keyword">import</span></span> simulation_class
<span class="hljs-keyword"><span class="hljs-keyword">import</span></span> math
<span class="hljs-keyword"><span class="hljs-keyword">from</span></span> sklearn.metrics <span class="hljs-keyword"><span class="hljs-keyword">import</span></span> mean_squared_error
<span class="hljs-keyword"><span class="hljs-keyword">from</span></span> sklearn.tree <span class="hljs-keyword"><span class="hljs-keyword">import</span></span> DecisionTreeRegressor

The module simulation_class is a user-specified class that we will not discuss in this blog post but in a subsequent one.

Further, we specify the simulation set-up:

<span class="hljs-comment"><span class="hljs-comment"># Number of regressors</span></span>
n_reg = <span class="hljs-number"><span class="hljs-number">10</span></span>

<span class="hljs-comment"><span class="hljs-comment"># Observations</span></span>
n_obs = <span class="hljs-number"><span class="hljs-number">500</span></span>

<span class="hljs-comment"><span class="hljs-comment"># Simulation runs</span></span>
n_sim = <span class="hljs-number"><span class="hljs-number">50</span></span>

<span class="hljs-comment"><span class="hljs-comment"># Number of trees, i.e. number of bootstrap samples (Step 1)</span></span>
n_tree = <span class="hljs-number"><span class="hljs-number">50</span></span>

<span class="hljs-comment"><span class="hljs-comment"># Error Variance</span></span>
sigma = <span class="hljs-number"><span class="hljs-number">1</span></span>

<span class="hljs-comment"><span class="hljs-comment"># Grid for subsample size</span></span>
start_grid = <span class="hljs-number"><span class="hljs-number">0.1</span></span>
end_grid = <span class="hljs-number"><span class="hljs-number">1</span></span>
n_grid = <span class="hljs-number"><span class="hljs-number">100</span></span>

grid_range = np.linspace(start_grid, end_grid, num = n_grid)

Below we will explain in more detail what we need the grid specification.

To store our simulation results we set up containers.

<span class="hljs-comment"><span class="hljs-comment"># Container Set-up</span></span>
mse_temp_bagging = np.empty(shape = (n_obs, n_sim))
mse_temp_subagging = np.empty(shape = (n_obs, n_sim))

y_predict_bagging = np.empty(shape = (n_obs, n_sim))
y_predict_subagging = np.empty(shape = (n_obs, n_sim))

mse_decomp = np.empty(shape = (len(grid_range),<span class="hljs-number"><span class="hljs-number">2</span></span>))

With this initialization at hand, we generate the test and train data by the simulation_class module.

<span class="hljs-comment"><span class="hljs-comment">#Creation of Simulation-Data</span></span>
train_setup = simulation_class.simulation(n_reg = n_reg,
                                          n_obs = n_obs,
                                          n_sim = n_sim,
                                          sigma = sigma,
                                          random_seed_design = <span class="hljs-number"><span class="hljs-number">0</span></span>,
                                          random_seed_noise =  <span class="hljs-number"><span class="hljs-number">1</span></span>)

test_setup = simulation_class.simulation(n_reg = n_reg,
                                         n_obs = n_obs,
                                         n_sim = n_sim,
                                         sigma = sigma,
                                         random_seed_design = <span class="hljs-number"><span class="hljs-number">2</span></span>,
                                         random_seed_noise = <span class="hljs-number"><span class="hljs-number">3</span></span>)

f_train = train_setup.friedman_model()
X_train, y_train = train_setup.error_term(f_train)

f_test = test_setup.friedman_model()
X_test, y_test = test_setup.error_term(f_test)

As we have generated the data for our "Friedman #1"-model we are now able to simulate the mean squared error of the Bagged predictor and Subagged predictor. In Python, both algorithms are implemented via the BaggingRegressor method of the sklearn.ensemble package. Observe that for the Subagged predictor we need to specify the parameter max_samples in the BaggingRegressor. This ensures that we can draw a subsample size m=acdotnm = a cdot{} n with subsample fraction aa from the original data. Indeed, for the subsample fraction aa we have already specified the grid above by the variable grid_range .

<span class="hljs-comment"><span class="hljs-comment">#Subagging-Simulation</span></span>
<span class="hljs-keyword"><span class="hljs-keyword">for</span></span> index, a <span class="hljs-keyword"><span class="hljs-keyword">in</span></span> enumerate(grid_range):
    <span class="hljs-keyword"><span class="hljs-keyword">for</span></span> i <span class="hljs-keyword"><span class="hljs-keyword">in</span></span> range(<span class="hljs-number"><span class="hljs-number">0</span></span>, n_sim):
        <span class="hljs-comment"><span class="hljs-comment"># bagged estimator</span></span>
        bagging = sklearn.ensemble.BaggingRegressor(
            bootstrap = <span class="hljs-keyword"><span class="hljs-keyword">True</span></span>,
            n_estimators = <span class="hljs-number"><span class="hljs-number">50</span></span>)

        y_predict_bagging[:,i] = bagging.fit(
            X_train,
            y_train[:,i]).predict(X_test)
        
        mse_temp_bagging[:,i] = mean_squared_error(
            y_test[:,i], 
            y_predict_bagging[:,i])
        
        <span class="hljs-comment"><span class="hljs-comment"># subagged estimator</span></span>
        subagging = sklearn.ensemble.BaggingRegressor(
            max_samples = math.ceil(a*n_obs),
            bootstrap = <span class="hljs-keyword"><span class="hljs-keyword">False</span></span>,
            n_estimators = <span class="hljs-number"><span class="hljs-number">50</span></span>)
        
        y_predict_subagging[:,i] = subagging.fit(
            X_train,
            y_train[:,i]).predict(X_test)
        
        mse_temp_subagging[:,i] = mean_squared_error(
            y_test[:,i],
            y_predict_subagging[:,i])
       
    mse_decomp[index, <span class="hljs-number"><span class="hljs-number">1</span></span>] = np.mean(mse_temp_bagging)
    mse_decomp[index, <span class="hljs-number"><span class="hljs-number">2</span></span>] = np.mean(mse_temp_subagging)

On my GitHub-Account you can find additional code which also calculates the simulated bias and variance for the fully grown tree and the Bagged tree.

Results

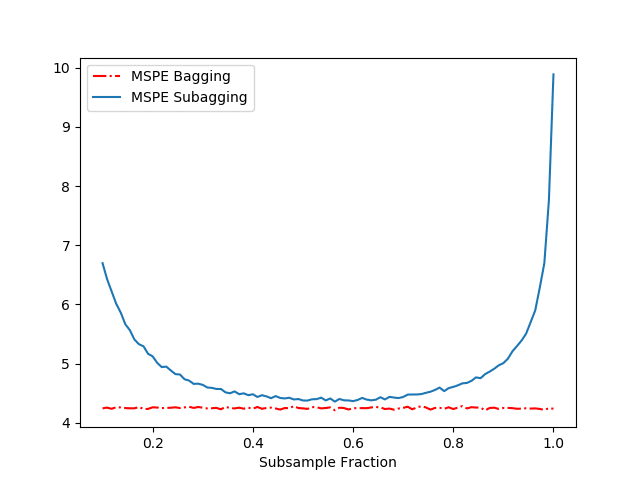
The results of our above simulation can be found in Figure 1.

Let us first compare the performance in terms of MSPE of the Regression Tree and the Bagged predictor. Table 1 shows us that Bagging drastically reduces the MSPE by decreasing the variance while almost not affecting the bias. (Recall - the mean squared prediction error is just the sum of the squared bias of the estimate, variance of the estimate and the variance of the error term (not reported).)

Table 1: Performance of fully grown tree and Bagged Predictor

Predictor Tree (fully grown) Bagged Tree
\( \text{Bias}^2 \) 3.47 2.94
\( \text{Variance} \) 6.13 0.35
\( \text{MSPE} \) 10.61 4.26

Figure 1 displays the MSPE as a function of the subsample fraction aa for the Bagged and Subagged predictor (our above code). Together with Figure 1 and Table 1, we make several observations:

  • We see that both the Bagged and Subagged predictor outperform a single tree (in terms of MSPE).
  • For a subsampling fraction of approximately 0.5, Subagging achieves nearly the same prediction performance as Bagging while coming at a lower computational cost.
MSPE-Comparison of Bagging and Subagging

References

  1. Breiman, L.: Bagging predictors. Machine Learning, 24, 123–140 (1996).
  2. Bühlmann, P., Yu, B.: Analyzing bagging. Annals of Statistics 30, 927–961 (2002).
Linkedin Logo
Marcel Plaschke
Head of Strategy, Sales & Marketing
schedule a consultation
Zugehörige Leistungen
No items found.

More Blog Posts

  • Artificial Intelligence
AI Trends Report 2025: All 16 Trends at a Glance
Tarik Ashry
05. February 2025
Read more
  • Artificial Intelligence
  • Data Science
  • Human-centered AI
Explainable AI in practice: Finding the right method to open the Black Box
Jonas Wacker
15. November 2024
Read more
  • Artificial Intelligence
  • Data Science
  • GenAI
How a CustomGPT Enhances Efficiency and Creativity at hagebau
Tarik Ashry
06. November 2024
Read more
  • Artificial Intelligence
  • Data Culture
  • Data Science
  • Deep Learning
  • GenAI
  • Machine Learning
AI Trends Report 2024: statworx COO Fabian Müller Takes Stock
Tarik Ashry
05. September 2024
Read more
  • Artificial Intelligence
  • Human-centered AI
  • Strategy
The AI Act is here – These are the risk classes you should know
Fabian Müller
05. August 2024
Read more
  • Artificial Intelligence
  • GenAI
  • statworx
Back to the Future: The Story of Generative AI (Episode 4)
Tarik Ashry
31. July 2024
Read more
  • Artificial Intelligence
  • GenAI
  • statworx
Back to the Future: The Story of Generative AI (Episode 3)
Tarik Ashry
24. July 2024
Read more
  • Artificial Intelligence
  • GenAI
  • statworx
Back to the Future: The Story of Generative AI (Episode 2)
Tarik Ashry
04. July 2024
Read more
  • Artificial Intelligence
  • GenAI
  • statworx
Back to the Future: The Story of Generative AI (Episode 1)
Tarik Ashry
10. July 2024
Read more
  • Artificial Intelligence
  • GenAI
  • statworx
Generative AI as a Thinking Machine? A Media Theory Perspective
Tarik Ashry
13. June 2024
Read more
  • Artificial Intelligence
  • GenAI
  • statworx
Custom AI Chatbots: Combining Strong Performance and Rapid Integration
Tarik Ashry
10. April 2024
Read more
  • Artificial Intelligence
  • Data Culture
  • Human-centered AI
How managers can strengthen the data culture in the company
Tarik Ashry
21. February 2024
Read more
  • Artificial Intelligence
  • Data Culture
  • Human-centered AI
AI in the Workplace: How We Turn Skepticism into Confidence
Tarik Ashry
08. February 2024
Read more
  • Artificial Intelligence
  • Data Science
  • GenAI
The Future of Customer Service: Generative AI as a Success Factor
Tarik Ashry
25. October 2023
Read more
  • Artificial Intelligence
  • Data Science
How we developed a chatbot with real knowledge for Microsoft
Isabel Hermes
27. September 2023
Read more
  • Data Science
  • Data Visualization
  • Frontend Solution
Why Frontend Development is Useful in Data Science Applications
Jakob Gepp
30. August 2023
Read more
  • Artificial Intelligence
  • Human-centered AI
  • statworx
the byte - How We Built an AI-Powered Pop-Up Restaurant
Sebastian Heinz
14. June 2023
Read more
  • Artificial Intelligence
  • Recap
  • statworx
Big Data & AI World 2023 Recap
Team statworx
24. May 2023
Read more
  • Data Science
  • Human-centered AI
  • Statistics & Methods
Unlocking the Black Box – 3 Explainable AI Methods to Prepare for the AI Act
Team statworx
17. May 2023
Read more
  • Artificial Intelligence
  • Human-centered AI
  • Strategy
How the AI Act will change the AI industry: Everything you need to know about it now
Team statworx
11. May 2023
Read more
  • Artificial Intelligence
  • Human-centered AI
  • Machine Learning
Gender Representation in AI – Part 2: Automating the Generation of Gender-Neutral Versions of Face Images
Team statworx
03. May 2023
Read more
  • Artificial Intelligence
  • Data Science
  • Statistics & Methods
A first look into our Forecasting Recommender Tool
Team statworx
26. April 2023
Read more
  • Artificial Intelligence
  • Data Science
On Can, Do, and Want – Why Data Culture and Death Metal have a lot in common
David Schlepps
19. April 2023
Read more
  • Artificial Intelligence
  • Human-centered AI
  • Machine Learning
GPT-4 - A categorisation of the most important innovations
Mareike Flögel
17. March 2023
Read more
  • Artificial Intelligence
  • Data Science
  • Strategy
Decoding the secret of Data Culture: These factors truly influence the culture and success of businesses
Team statworx
16. March 2023
Read more
  • Artificial Intelligence
  • Deep Learning
  • Machine Learning
How to create AI-generated avatars using Stable Diffusion and Textual Inversion
Team statworx
08. March 2023
Read more
  • Artificial Intelligence
  • Human-centered AI
  • Strategy
Knowledge Management with NLP: How to easily process emails with AI
Team statworx
02. March 2023
Read more
  • Artificial Intelligence
  • Deep Learning
  • Machine Learning
3 specific use cases of how ChatGPT will revolutionize communication in companies
Ingo Marquart
16. February 2023
Read more
  • Recap
  • statworx
Ho ho ho – Christmas Kitchen Party
Julius Heinz
22. December 2022
Read more
  • Artificial Intelligence
  • Deep Learning
  • Machine Learning
Real-Time Computer Vision: Face Recognition with a Robot
Sarah Sester
30. November 2022
Read more
  • Data Engineering
  • Tutorial
Data Engineering – From Zero to Hero
Thomas Alcock
23. November 2022
Read more
  • Recap
  • statworx
statworx @ UXDX Conf 2022
Markus Berroth
18. November 2022
Read more
  • Artificial Intelligence
  • Machine Learning
  • Tutorial
Paradigm Shift in NLP: 5 Approaches to Write Better Prompts
Team statworx
26. October 2022
Read more
  • Recap
  • statworx
statworx @ vuejs.de Conf 2022
Jakob Gepp
14. October 2022
Read more
  • Data Engineering
  • Data Science
Application and Infrastructure Monitoring and Logging: metrics and (event) logs
Team statworx
29. September 2022
Read more
  • Coding
  • Data Science
  • Machine Learning
Zero-Shot Text Classification
Fabian Müller
29. September 2022
Read more
  • Cloud Technology
  • Data Engineering
  • Data Science
How to Get Your Data Science Project Ready for the Cloud
Alexander Broska
14. September 2022
Read more
  • Artificial Intelligence
  • Human-centered AI
  • Machine Learning
Gender Repre­sentation in AI – Part 1: Utilizing StyleGAN to Explore Gender Directions in Face Image Editing
Isabel Hermes
18. August 2022
Read more
  • Artificial Intelligence
  • Human-centered AI
statworx AI Principles: Why We Started Developing Our Own AI Guidelines
Team statworx
04. August 2022
Read more
  • Data Engineering
  • Data Science
  • Python
How to Scan Your Code and Dependencies in Python
Thomas Alcock
21. July 2022
Read more
  • Data Engineering
  • Data Science
  • Machine Learning
Data-Centric AI: From Model-First to Data-First AI Processes
Team statworx
13. July 2022
Read more
  • Artificial Intelligence
  • Deep Learning
  • Human-centered AI
  • Machine Learning
DALL-E 2: Why Discrimination in AI Development Cannot Be Ignored
Team statworx
28. June 2022
Read more
  • R
The helfRlein package – A collection of useful functions
Jakob Gepp
23. June 2022
Read more
  • Recap
  • statworx
Unfold 2022 in Bern – by Cleverclip
Team statworx
11. May 2022
Read more
  • Artificial Intelligence
  • Data Science
  • Human-centered AI
  • Machine Learning
Break the Bias in AI
Team statworx
08. March 2022
Read more
  • Artificial Intelligence
  • Cloud Technology
  • Data Science
  • Sustainable AI
How to Reduce the AI Carbon Footprint as a Data Scientist
Team statworx
02. February 2022
Read more
  • Recap
  • statworx
2022 and the rise of statworx next
Sebastian Heinz
06. January 2022
Read more
  • Recap
  • statworx
5 highlights from the Zurich Digital Festival 2021
Team statworx
25. November 2021
Read more
  • Data Science
  • Human-centered AI
  • Machine Learning
  • Strategy
Why Data Science and AI Initiatives Fail – A Reflection on Non-Technical Factors
Team statworx
22. September 2021
Read more
  • Artificial Intelligence
  • Data Science
  • Human-centered AI
  • Machine Learning
  • statworx
Column: Human and machine side by side
Sebastian Heinz
03. September 2021
Read more
  • Coding
  • Data Science
  • Python
How to Automatically Create Project Graphs With Call Graph
Team statworx
25. August 2021
Read more
  • Coding
  • Python
  • Tutorial
statworx Cheatsheets – Python Basics Cheatsheet for Data Science
Team statworx
13. August 2021
Read more
  • Data Science
  • statworx
  • Strategy
STATWORX meets DHBW – Data Science Real-World Use Cases
Team statworx
04. August 2021
Read more
  • Data Engineering
  • Data Science
  • Machine Learning
Deploy and Scale Machine Learning Models with Kubernetes
Team statworx
29. July 2021
Read more
  • Cloud Technology
  • Data Engineering
  • Machine Learning
3 Scenarios for Deploying Machine Learning Workflows Using MLflow
Team statworx
30. June 2021
Read more
  • Artificial Intelligence
  • Deep Learning
  • Machine Learning
Car Model Classification III: Explainability of Deep Learning Models With Grad-CAM
Team statworx
19. May 2021
Read more
  • Artificial Intelligence
  • Coding
  • Deep Learning
Car Model Classification II: Deploying TensorFlow Models in Docker Using TensorFlow Serving
No items found.
12. May 2021
Read more
  • Coding
  • Deep Learning
Car Model Classification I: Transfer Learning with ResNet
Team statworx
05. May 2021
Read more
  • Artificial Intelligence
  • Deep Learning
  • Machine Learning
Car Model Classification IV: Integrating Deep Learning Models With Dash
Dominique Lade
05. May 2021
Read more
  • AI Act
Potential Not Yet Fully Tapped – A Commentary on the EU’s Proposed AI Regulation
Team statworx
28. April 2021
Read more
  • Artificial Intelligence
  • Deep Learning
  • statworx
Creaition – revolutionizing the design process with machine learning
Team statworx
31. March 2021
Read more
  • Artificial Intelligence
  • Data Science
  • Machine Learning
5 Types of Machine Learning Algorithms With Use Cases
Team statworx
24. March 2021
Read more
  • Recaps
  • statworx
2020 – A Year in Review for Me and GPT-3
Sebastian Heinz
23. Dezember 2020
Read more
  • Artificial Intelligence
  • Deep Learning
  • Machine Learning
5 Practical Examples of NLP Use Cases
Team statworx
12. November 2020
Read more
  • Data Science
  • Deep Learning
The 5 Most Important Use Cases for Computer Vision
Team statworx
11. November 2020
Read more
  • Data Science
  • Deep Learning
New Trends in Natural Language Processing – How NLP Becomes Suitable for the Mass-Market
Dominique Lade
29. October 2020
Read more
  • Data Engineering
5 Technologies That Every Data Engineer Should Know
Team statworx
22. October 2020
Read more
  • Artificial Intelligence
  • Data Science
  • Machine Learning

Generative Adversarial Networks: How Data Can Be Generated With Neural Networks
Team statworx
10. October 2020
Read more
  • Coding
  • Data Science
  • Deep Learning
Fine-tuning Tesseract OCR for German Invoices
Team statworx
08. October 2020
Read more
  • Artificial Intelligence
  • Machine Learning
Whitepaper: A Maturity Model for Artificial Intelligence
Team statworx
06. October 2020
Read more
  • Data Engineering
  • Data Science
  • Machine Learning
How to Provide Machine Learning Models With the Help Of Docker Containers
Thomas Alcock
01. October 2020
Read more
  • Recap
  • statworx
STATWORX 2.0 – Opening of the New Headquarters in Frankfurt
Julius Heinz
24. September 2020
Read more
  • Machine Learning
  • Python
  • Tutorial
How to Build a Machine Learning API with Python and Flask
Team statworx
29. July 2020
Read more
  • Data Science
  • Statistics & Methods
Model Regularization – The Bayesian Way
Thomas Alcock
15. July 2020
Read more
  • Recap
  • statworx
Off To New Adventures: STATWORX Office Soft Opening
Team statworx
14. July 2020
Read more
  • Data Engineering
  • R
  • Tutorial
How To Dockerize ShinyApps
Team statworx
15. May 2020
Read more
  • Coding
  • Python
Making Of: A Free API For COVID-19 Data
Sebastian Heinz
01. April 2020
Read more
  • Frontend
  • Python
  • Tutorial
How To Build A Dashboard In Python – Plotly Dash Step-by-Step Tutorial
Alexander Blaufuss
26. March 2020
Read more
  • Coding
  • R
Why Is It Called That Way?! – Origin and Meaning of R Package Names
Team statworx
19. March 2020
Read more
  • Data Visualization
  • R
Community Detection with Louvain and Infomap
Team statworx
04. March 2020
Read more
  • Coding
  • Data Engineering
  • Data Science
Testing REST APIs With Newman
Team statworx
26. February 2020
Read more
  • Coding
  • Frontend
  • R
Dynamic UI Elements in Shiny – Part 2
Team statworx
19. Febuary 2020
Read more
  • Coding
  • Data Visualization
  • R
Animated Plots using ggplot and gganimate
Team statworx
14. Febuary 2020
Read more
  • Machine Learning
Machine Learning Goes Causal II: Meet the Random Forest’s Causal Brother
Team statworx
05. February 2020
Read more
  • Artificial Intelligence
  • Machine Learning
  • Statistics & Methods
Machine Learning Goes Causal I: Why Causality Matters
Team statworx
29.01.2020
Read more
  • Data Engineering
  • R
  • Tutorial
How To Create REST APIs With R Plumber
Stephan Emmer
23. January 2020
Read more
  • Recaps
  • statworx
statworx 2019 – A Year in Review
Sebastian Heinz
20. Dezember 2019
Read more
  • Artificial Intelligence
  • Deep Learning
Deep Learning Overview and Getting Started
Team statworx
04. December 2019
Read more
  • Coding
  • Machine Learning
  • R
Tuning Random Forest on Time Series Data
Team statworx
21. November 2019
Read more
  • Data Science
  • R
Combining Price Elasticities and Sales Forecastings for Sales Improvement
Team statworx
06. November 2019
Read more
  • Data Engineering
  • Python
Access your Spark Cluster from Everywhere with Apache Livy
Team statworx
30. October 2019
Read more
  • Recap
  • statworx
STATWORX on Tour: Wine, Castles & Hiking!
Team statworx
18. October 2019
Read more
  • Data Science
  • R
  • Statistics & Methods
Evaluating Model Performance by Building Cross-Validation from Scratch
Team statworx
02. October 2019
Read more
  • Data Science
  • Machine Learning
  • R
Time Series Forecasting With Random Forest
Team statworx
25. September 2019
Read more
  • Coding
  • Frontend
  • R
Dynamic UI Elements in Shiny – Part 1
Team statworx
11. September 2019
Read more
  • Machine Learning
  • R
  • Statistics & Methods
What the Mape Is FALSELY Blamed For, Its TRUE Weaknesses and BETTER Alternatives!
Team statworx
16. August 2019
Read more
  • Coding
  • Python
Web Scraping 101 in Python with Requests & BeautifulSoup
Team statworx
31. July 2019
Read more
  • Coding
  • Frontend
  • R
Getting Started With Flexdashboards in R
Thomas Alcock
19. July 2019
Read more
  • Recap
  • statworx
statworx summer barbecue 2019
Team statworx
21. June 2019
Read more
  • Data Visualization
  • R
Interactive Network Visualization with R
Team statworx
12. June 2019
Read more
This is some text inside of a div block.