Back to all Blog Posts

Getting Started With Flexdashboards in R

  • Coding
  • Frontend
  • R
19. July 2019
·

Thomas Alcock
Team AI Development

Introduction

Here at statworx, we value reader-friendly presentations of our work. For many R users, the choice is usually a Markdown file that generates a .html or .pdf document, or a Shiny application, which provides users with an easily navigable dashboard.

What if you want to construct a dashboard-style presentation without much hassle? Well, look no further. R Studio’s package flexdashboard gives data scientists a Markdown-based way of easily setting up dashboards without having to resort to full-on front end development. Using Shiny may be a bit too involved when the goal is to present your work in a dashboard.

Why should you learn about flexdashboards ? If you’re familiar with R Markdown and know a bit about Shiny, flexdashboards are easy to learn and give you an alternative to Shiny dashboards.

In this post, you will learn the basics on how to design a flexdashboard. By the end of this article, you’ll be able to :

  • build a simple dashboard involving multiple pages
  • put tabs on each page and adjust the layout
  • integrate widgets
  • deploy your Shiny document on ShinyApps.io.

The basic rules

To set up a flexdashboard, install the package from CRAN using the standard command. To get started, enter the following into the console:

rmarkdown::draft(file = "my_dashboard", template = "flex_dashboard", package = "flexdashboard")


This function creates a .Rmd file with the name associated file name, and uses the package’s flexdashboard template. Rendering your newly created dashboard, you get a column-oriented layout with a header, one page, and three boxes. By default, the page is divided into columns, and the left-hand column is made to be double the height of the two right-hand boxes.

You can change the layout-orientation to rows and also select a different theme. Adding runtime: shiny to the YAML header allows you to use HTML widgets.

Each row (or column) is created using the ——— header, and the panels themselves are created with a ### header followed by the title of the panel. You can introduce tabsetting for each row by adding the {.tabset} attribute after its name. To add a page, use the (=======) header and put the page name above it. Row height can be modified by using {.data-height = } after a row name if you chose a row-oriented layout. Depending on the layout, it may make sense to use {.data-width = } instead.

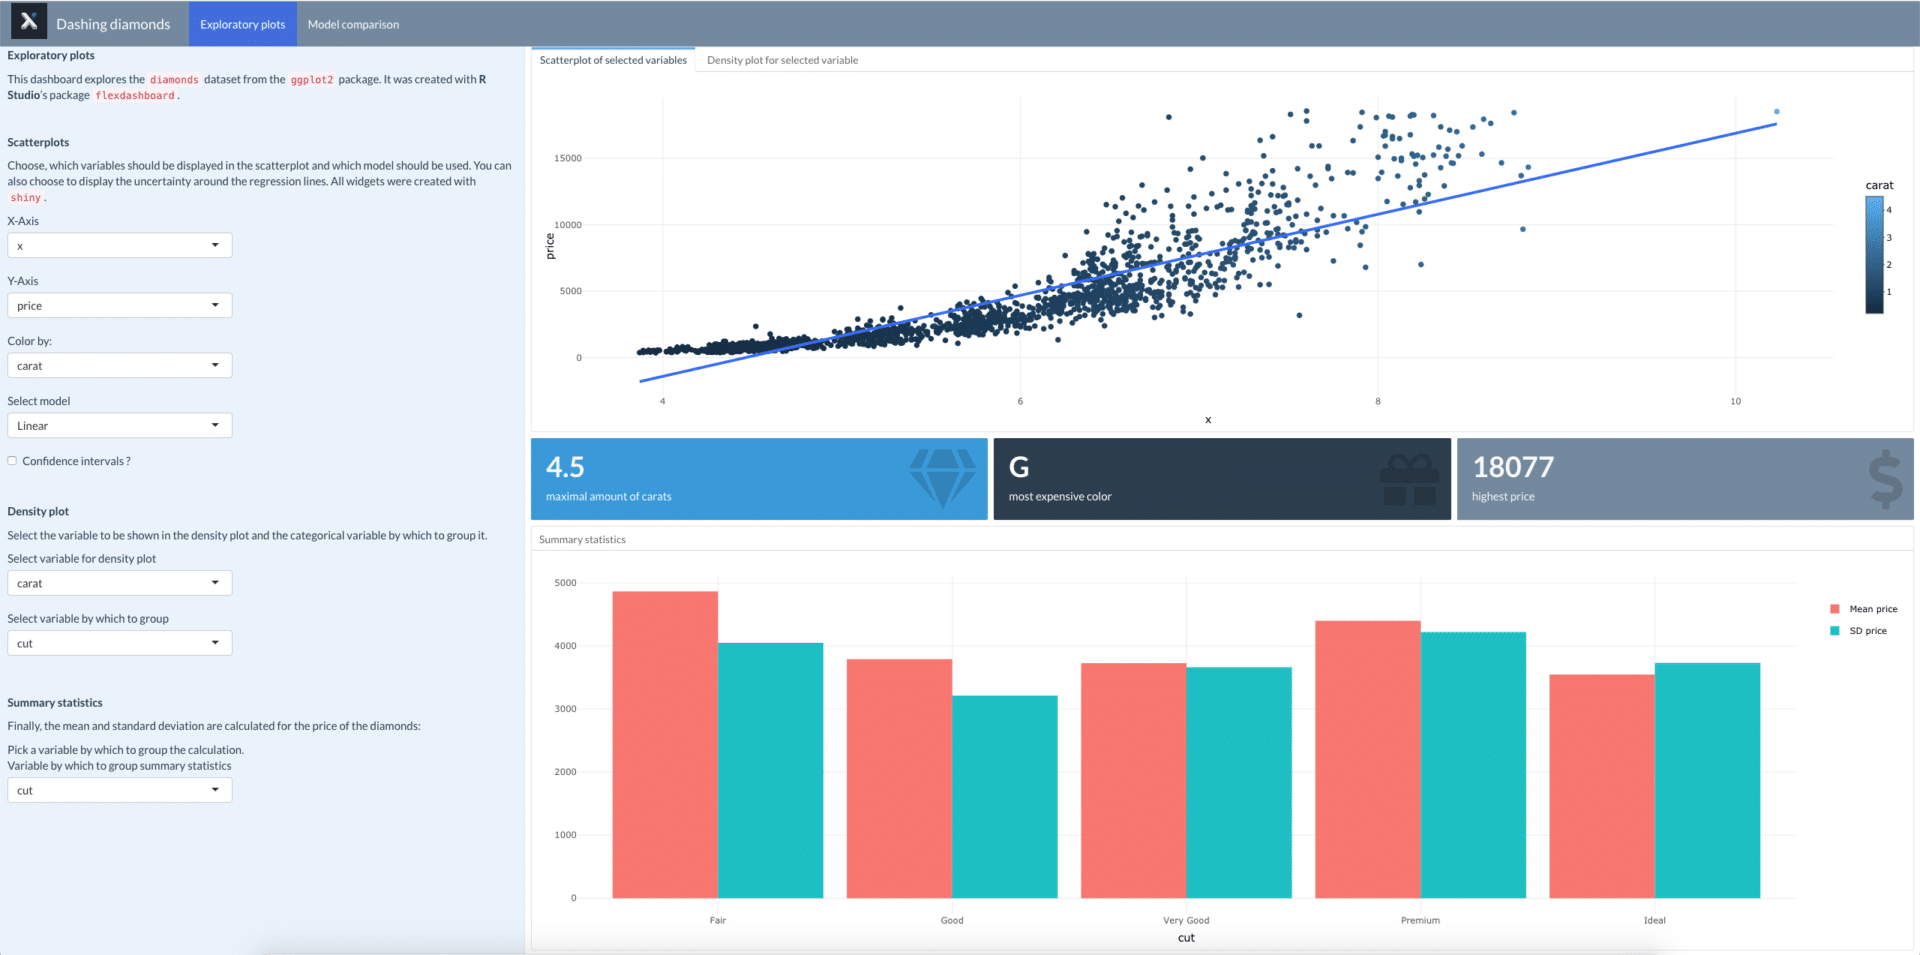
Here, I’ll design a dashboard which explores the famous diamonds dataset, found in the ggplot2 package. While the first page contains some exploratory plots, the second page compares the performance of a linear model and a ridge regression in predicting the price.

This is the skeleton of the dashboard (minus R code and descriptive text):

---
title: "Dashing diamonds"
output: 
  flexdashboard::flex_dashboard:
    orientation: rows
    vertical_layout: fill
    css: bootswatch-3.3.5-4/flatly/bootstrap.css
    logo: STATWORX_2.jpg
runtime: shiny
---

Exploratory plots 
=======================================================================

Sidebar {.sidebar data-width=700} 
-----------------------------------------------------------------------

**Exploratory plots**

<br>

**Scatterplots**

<br>

**Density plot**

<br>

**Summary statistics**

<br>


Row {.tabset}
-----------------------------------------------------------------------

### Scatterplot of selected variables

### Density plot for selected variable

Row 
-----------------------------------------------------------------------

### Maximum carats {data-width=50}

### Most expensive color {data-width=50}

### Maximal price {data-width=50}

Row {data-height=500}
-----------------------------------------------------------------------

### Summary statistics {data-width=500}

Model comparison
=======================================================================

Sidebar {.sidebar data-width=700}
-----------------------------------------------------------------------

**Model comparison**

<br>

Row{.tabset}
-----------------------------------------------------------------------

 **Comparison of Predictions and Target**

### Linear Model

### Ridge Regression 

Row
-----------------------------------------------------------------------
### Densities of predictions vs. target


The sidebars were added by specifying the attribute {.sidebar} after the name, followed by a page or row header. Page headers (========) create global sidebars, whereas local sidebars are made using row headers (---------). If you choose a global sidebar, it appears on all pages whereas a local sidebar only appears on the page it is put on. In general, it’s a good idea to add the sidebar after the beginning of the page and before the first row of the page. Sidebars are also good for adding descriptions of what your dashboard/application is about. Here I also changed the width using the attribute data-width. That widens the sidebar and makes the description easier to read. You can also display outputs in your sidebar by adding code chunks below it.

Adding interactive widgets

Now that the basic layout is done let’s add some interactivity. Below the description in the sidebar on the first page, I’ve added several widgets.

```{r}
selectInput("x", "X-Axis", choices = names(train_df), selected = "x")
selectInput("y", "Y-Axis", choices = names(train_df), selected = "price")
selectInput("z", "Color by:", choices = names(train_df), selected = "carat")
selectInput("model_type", "Select model", choices = c("LOESS" = "loess", "Linear" = "lm"), selected = "lm")
checkboxInput("se", "Confidence intervals ?")
```

Notice that the widgets are identical to those you typically find in a Shiny application and they’ll work because runtime: shiny is specified in the YAML.

To make the plots react to changes in the date selection, you need to specify the input ID’s of your widgets within the appropriate render function. For example, the scatterplot is rendered as a plotly output:

```{r}
renderPlotly({
  p <- train_df %>% 
  	ggplot(aes_string(x = input$x, y = input$y, col = input$z)) + 
    geom_point() +
    theme_minimal() + 
    geom_smooth(method = input$model_type, position = "identity", se = input$se) + 
    labs(x = input$x, y = input$y)
  
  p %>% ggplotly()
})
​```

You can use the render functions you would also use in a Shiny application. Of course, you don’t have to use render-functions to display graphics, but they have the advantage of resizing the plots whenever the browser window is resized.

Adding value boxes

Aside from plots and tables, one of the more stylish features of dashboards are value boxes. flexdashboard provides its own function for value boxes, with which you can nicely convey information about key indicators relevant to your work. Here, I’ll add three such boxes displaying the maximal price, the most expensive color of diamonds and the maximal amount of carats found in the dataset.

flexdashboard::valueBox(max(train_df$carat), 
                        caption = "maximal amount of carats",
                        color = "info",
                        icon = "fa-gem")


There are multiple sources from which icons can be drawn. In this example, I’ve used the gem icon from font awesome. This code chunk follows a header for what would otherwise be a plot or a table, i.e., a ### header.

Final touches and deployment

UTo finalize your dashboard, you can add a logo and chose from one of several themes, or attach a CSS file. Here, I’ve added a bootswatch theme and modified the colors slightly. Most themes require the logo to be 48×48 pixels large.

---
title: "Dashing diamonds"
output: 
  flexdashboard::flex_dashboard:
    orientation: rows
    vertical_layout: fill
    css: bootswatch-3.3.5-4/flatly/bootstrap.css
    logo: STATWORX_2.jpg
runtime: shiny
---

After creating your dashboard with runtime: shiny, it can be hosted on ShinyApps.io, provided you have an account. You also need to install the package rsconnect. The document can be published with the ‘publish to server’ in RStudio or with:

rsconnect::deployDoc('path')


You can use this function after you’ve obtained your account and authorized it using rsconnect::setAccountInfo() with an access token and a secret provided by the website. Make sure that all of the necessary files are part of the same folder. RStudio’s publish to server has the advantage of automatically recognizing the external files your application requires. You can view the example dashboard here and the code on our GitHub page.

Recap

In this post, you’ve learned how to set up a flexdashboard, customize and deploy it – all without knowing JavaScript or CSS, or even much R Shiny. However, what you’ve learned here is only the beginning! This powerful package also allows you to create storyboards, integrate them in a more modularized way with R Shiny and even set up dashboards for mobile devices. We will explore these topics together in future posts. Stay tuned!

Linkedin Logo
Marcel Plaschke
Head of Strategy, Sales & Marketing
schedule a consultation
Zugehörige Leistungen
No items found.

More Blog Posts

  • Coding
  • Data Science
  • Machine Learning
Zero-Shot Text Classification
Fabian Müller
17.4.2025
Read more
  • Coding
  • Python
Making Of: A Free API For COVID-19 Data
Sebastian Heinz
17.4.2025
Read more
  • Coding
  • Python
  • R
R and Python: Using Reticulate to Get the Best of Both Worlds
Team statworx
17.4.2025
Read more
  • Artificial Intelligence
  • Machine Learning
  • Statistics & Methods
Machine Learning Goes Causal I: Why Causality Matters
Team statworx
17.4.2025
Read more
  • Coding
  • Data Visualization
  • R
Coordinate Systems in ggplot2: Easily Overlooked and Rather Underrated
Team statworx
17.4.2025
Read more
  • Data Engineering
  • R
  • Tutorial
How To Create REST APIs With R Plumber
Stephan Emmer
17.4.2025
Read more
  • Coding
  • Frontend
  • R
Dynamic UI Elements in Shiny – Part 1
Team statworx
17.4.2025
Read more
  • Recaps
  • statworx
statworx 2019 – A Year in Review
Sebastian Heinz
17.4.2025
Read more
  • Recap
  • statworx
STATWORX on Tour: Wine, Castles & Hiking!
Team statworx
17.4.2025
Read more
  • Recap
  • statworx
Off To New Adventures: STATWORX Office Soft Opening
Team statworx
17.4.2025
Read more
  • Recap
  • statworx
STATWORX on Tour: Year-End-Event in Belgium
Sebastian Heinz
17.4.2025
Read more
  • Recap
  • statworx
statworx summer barbecue 2019
Team statworx
17.4.2025
Read more
  • Coding
  • R
  • Tutorial
Compiling R Code in Sublime Text
Team statworx
17.4.2025
Read more
  • Coding
  • R
  • Tutorial
Make RStudio Look the Way You Want — Because Beauty Matters
Team statworx
17.4.2025
Read more
  • Recaps
  • statworx
2020 – A Year in Review for Me and GPT-3
Sebastian Heinz
17.4.2025
Read more
  • Coding
  • R
Master R shiny: One trick to build maintainable and scaleable event chains
Team statworx
17.4.2025
Read more
  • Coding
  • Python
  • Statistics & Methods
Ensemble Methods in Machine Learning: Bagging & Subagging
Team statworx
15.4.2025
Read more
  • Deep Learning
  • Python
  • Tutorial
Using Reinforcement Learning to play Super Mario Bros on NES using TensorFlow
Sebastian Heinz
15.4.2025
Read more
  • Coding
  • Machine Learning
  • R
Tuning Random Forest on Time Series Data
Team statworx
15.4.2025
Read more
  • Data Science
  • Statistics & Methods
Model Regularization – The Bayesian Way
Thomas Alcock
15.4.2025
Read more
  • Coding
  • Python
  • Statistics & Methods
How to Speed Up Gradient Boosting by a Factor of Two
Team statworx
15.4.2025
Read more
  • Coding
  • Frontend
  • R
Dynamic UI Elements in Shiny – Part 2
Team statworx
15.4.2025
Read more
  • Coding
  • R
Why Is It Called That Way?! – Origin and Meaning of R Package Names
Team statworx
15.4.2025
Read more
  • Data Engineering
  • Python
Access your Spark Cluster from Everywhere with Apache Livy
Team statworx
15.4.2025
Read more
  • Coding
  • Data Engineering
  • Data Science
Testing REST APIs With Newman
Team statworx
14.4.2025
Read more
  • Machine Learning
  • Python
  • R
XGBoost Tree vs. Linear
Fabian Müller
14.4.2025
Read more
  • Data Science
  • R
Combining Price Elasticities and Sales Forecastings for Sales Improvement
Team statworx
14.4.2025
Read more
  • Data Science
  • Machine Learning
  • R
Time Series Forecasting With Random Forest
Team statworx
14.4.2025
Read more
  • Data Visualization
  • R
Community Detection with Louvain and Infomap
Team statworx
14.4.2025
Read more
  • Machine Learning
Machine Learning Goes Causal II: Meet the Random Forest’s Causal Brother
Team statworx
11.4.2025
Read more
  • Coding
  • Data Visualization
  • R
Animated Plots using ggplot and gganimate
Team statworx
8.4.2025
Read more
  • Artificial Intelligence
AI Trends Report 2025: All 16 Trends at a Glance
Tarik Ashry
25.2.2025
Read more
  • Artificial Intelligence
  • Data Science
  • GenAI
How a CustomGPT Enhances Efficiency and Creativity at hagebau
Tarik Ashry
15.1.2025
Read more
  • Artificial Intelligence
  • Data Science
  • Human-centered AI
Explainable AI in practice: Finding the right method to open the Black Box
Jonas Wacker
15.1.2025
Read more
  • Artificial Intelligence
  • GenAI
  • statworx
Back to the Future: The Story of Generative AI (Episode 4)
Tarik Ashry
6.12.2024
Read more
  • Artificial Intelligence
  • GenAI
  • statworx
Back to the Future: The Story of Generative AI (Episode 3)
Tarik Ashry
6.12.2024
Read more
  • Artificial Intelligence
  • GenAI
  • statworx
Back to the Future: The Story of Generative AI (Episode 2)
Tarik Ashry
6.12.2024
Read more
  • Artificial Intelligence
  • Data Culture
  • Data Science
  • Deep Learning
  • GenAI
  • Machine Learning
AI Trends Report 2024: statworx COO Fabian Müller Takes Stock
Tarik Ashry
6.12.2024
Read more
  • Artificial Intelligence
  • GenAI
  • statworx
Custom AI Chatbots: Combining Strong Performance and Rapid Integration
Tarik Ashry
6.12.2024
Read more
  • Artificial Intelligence
  • GenAI
  • statworx
Back to the Future: The Story of Generative AI (Episode 1)
Tarik Ashry
6.12.2024
Read more
  • Artificial Intelligence
  • Data Culture
  • Human-centered AI
AI in the Workplace: How We Turn Skepticism into Confidence
Tarik Ashry
6.12.2024
Read more
  • Artificial Intelligence
  • GenAI
  • statworx
Generative AI as a Thinking Machine? A Media Theory Perspective
Tarik Ashry
6.12.2024
Read more
  • Artificial Intelligence
  • Data Culture
  • Human-centered AI
How managers can strengthen the data culture in the company
Tarik Ashry
6.12.2024
Read more
  • Artificial Intelligence
  • Data Science
How we developed a chatbot with real knowledge for Microsoft
Isabel Hermes
6.12.2024
Read more
  • Data Science
  • Data Visualization
  • Frontend Solution
Why Frontend Development is Useful in Data Science Applications
Jakob Gepp
6.12.2024
Read more
  • Artificial Intelligence
  • Human-centered AI
  • statworx
the byte - How We Built an AI-Powered Pop-Up Restaurant
Sebastian Heinz
6.12.2024
Read more
  • Artificial Intelligence
  • Data Science
  • GenAI
The Future of Customer Service: Generative AI as a Success Factor
Tarik Ashry
6.12.2024
Read more
  • Artificial Intelligence
  • Human-centered AI
  • Strategy
The AI Act is here – These are the risk classes you should know
Fabian Müller
6.12.2024
Read more
  • Artificial Intelligence
  • Human-centered AI
  • Machine Learning
Gender Representation in AI – Part 2: Automating the Generation of Gender-Neutral Versions of Face Images
Team statworx
6.12.2024
Read more
  • Data Science
  • Human-centered AI
  • Statistics & Methods
Unlocking the Black Box – 3 Explainable AI Methods to Prepare for the AI Act
Team statworx
6.12.2024
Read more
  • Artificial Intelligence
  • Human-centered AI
  • Strategy
How the AI Act will change the AI industry: Everything you need to know about it now
Team statworx
6.12.2024
Read more
  • Artificial Intelligence
  • Recap
  • statworx
Big Data & AI World 2023 Recap
Team statworx
6.12.2024
Read more
  • Artificial Intelligence
  • Data Science
  • Statistics & Methods
A first look into our Forecasting Recommender Tool
Team statworx
6.12.2024
Read more
  • Artificial Intelligence
  • Data Science
On Can, Do, and Want – Why Data Culture and Death Metal have a lot in common
David Schlepps
6.12.2024
Read more
  • Artificial Intelligence
  • Deep Learning
  • Machine Learning
How to create AI-generated avatars using Stable Diffusion and Textual Inversion
Team statworx
6.12.2024
Read more
  • Artificial Intelligence
  • Data Science
  • Strategy
Decoding the secret of Data Culture: These factors truly influence the culture and success of businesses
Team statworx
6.12.2024
Read more
  • Artificial Intelligence
  • Human-centered AI
  • Machine Learning
GPT-4 - A categorisation of the most important innovations
Mareike Flögel
6.12.2024
Read more
  • Artificial Intelligence
  • Human-centered AI
  • Strategy
Knowledge Management with NLP: How to easily process emails with AI
Team statworx
6.12.2024
Read more
  • Artificial Intelligence
  • Deep Learning
  • Machine Learning
3 specific use cases of how ChatGPT will revolutionize communication in companies
Ingo Marquart
6.12.2024
Read more
  • Artificial Intelligence
  • Machine Learning
  • Tutorial
Paradigm Shift in NLP: 5 Approaches to Write Better Prompts
Team statworx
6.12.2024
Read more
  • Recap
  • statworx
Ho ho ho – Christmas Kitchen Party
Julius Heinz
6.12.2024
Read more
  • Artificial Intelligence
  • Deep Learning
  • Machine Learning
Real-Time Computer Vision: Face Recognition with a Robot
Sarah Sester
6.12.2024
Read more
  • Recap
  • statworx
statworx @ UXDX Conf 2022
Markus Berroth
6.12.2024
Read more
  • Data Engineering
  • Tutorial
Data Engineering – From Zero to Hero
Thomas Alcock
6.12.2024
Read more
  • Recap
  • statworx
statworx @ vuejs.de Conf 2022
Jakob Gepp
6.12.2024
Read more
  • Data Engineering
  • Data Science
Application and Infrastructure Monitoring and Logging: metrics and (event) logs
Team statworx
6.12.2024
Read more
  • Data Engineering
  • Data Science
  • Python
How to Scan Your Code and Dependencies in Python
Thomas Alcock
6.12.2024
Read more
  • Cloud Technology
  • Data Engineering
  • Data Science
How to Get Your Data Science Project Ready for the Cloud
Alexander Broska
6.12.2024
Read more
  • Artificial Intelligence
  • Human-centered AI
  • Machine Learning
Gender Repre­sentation in AI – Part 1: Utilizing StyleGAN to Explore Gender Directions in Face Image Editing
Isabel Hermes
6.12.2024
Read more
  • R
The helfRlein package – A collection of useful functions
Jakob Gepp
6.12.2024
Read more
  • Data Engineering
  • Data Science
  • Machine Learning
Data-Centric AI: From Model-First to Data-First AI Processes
Team statworx
6.12.2024
Read more
  • Artificial Intelligence
  • Deep Learning
  • Human-centered AI
  • Machine Learning
DALL-E 2: Why Discrimination in AI Development Cannot Be Ignored
Team statworx
6.12.2024
Read more
  • Artificial Intelligence
  • Human-centered AI
statworx AI Principles: Why We Started Developing Our Own AI Guidelines
Team statworx
6.12.2024
Read more
  • Recap
  • statworx
5 highlights from the Zurich Digital Festival 2021
Team statworx
6.12.2024
Read more
  • Recap
  • statworx
Unfold 2022 in Bern – by Cleverclip
Team statworx
6.12.2024
Read more
  • Data Science
  • Human-centered AI
  • Machine Learning
  • Strategy
Why Data Science and AI Initiatives Fail – A Reflection on Non-Technical Factors
Team statworx
6.12.2024
Read more
  • Machine Learning
  • Python
  • Tutorial
How to Build a Machine Learning API with Python and Flask
Team statworx
6.12.2024
Read more
  • Artificial Intelligence
  • Data Science
  • Human-centered AI
  • Machine Learning
Break the Bias in AI
Team statworx
6.12.2024
Read more
  • Artificial Intelligence
  • Cloud Technology
  • Data Science
  • Sustainable AI
How to Reduce the AI Carbon Footprint as a Data Scientist
Team statworx
6.12.2024
Read more
  • Coding
  • Data Engineering
Automated Creation of Docker Containers
Stephan Emmer
6.12.2024
Read more
  • Coding
  • Data Visualization
  • R
Customizing Time and Date Scales in ggplot2
Team statworx
6.12.2024
Read more
  • Artificial Intelligence
  • Data Science
  • Machine Learning
5 Types of Machine Learning Algorithms With Use Cases
Team statworx
6.12.2024
Read more
  • Coding
  • Machine Learning
  • Python
Data Science in Python - Getting started with Machine Learning with Scikit-Learn
Team statworx
6.12.2024
Read more
  • Recap
  • statworx
2022 and the rise of statworx next
Sebastian Heinz
6.12.2024
Read more
  • Recap
  • statworx
As a Data Science Intern at statworx
Team statworx
6.12.2024
Read more
  • Coding
  • Data Science
  • Python
How to Automatically Create Project Graphs With Call Graph
Team statworx
6.12.2024
Read more
  • Artificial Intelligence
  • Data Science
  • Human-centered AI
  • Machine Learning
  • statworx
Column: Human and machine side by side
Sebastian Heinz
6.12.2024
Read more
  • Data Engineering
  • Data Science
  • Machine Learning
Deploy and Scale Machine Learning Models with Kubernetes
Team statworx
6.12.2024
Read more
  • Coding
  • Python
  • Tutorial
statworx Cheatsheets – Python Basics Cheatsheet for Data Science
Team statworx
6.12.2024
Read more
  • Cloud Technology
  • Data Engineering
  • Machine Learning
3 Scenarios for Deploying Machine Learning Workflows Using MLflow
Team statworx
6.12.2024
Read more
  • Data Science
  • statworx
  • Strategy
STATWORX meets DHBW – Data Science Real-World Use Cases
Team statworx
6.12.2024
Read more
  • Coding
  • Deep Learning
Car Model Classification I: Transfer Learning with ResNet
Team statworx
6.12.2024
Read more
  • Artificial Intelligence
  • Deep Learning
  • Machine Learning
Car Model Classification IV: Integrating Deep Learning Models With Dash
Dominique Lade
6.12.2024
Read more
  • Artificial Intelligence
  • Deep Learning
  • Machine Learning
Car Model Classification III: Explainability of Deep Learning Models With Grad-CAM
Team statworx
6.12.2024
Read more
  • Artificial Intelligence
  • Coding
  • Deep Learning
Car Model Classification II: Deploying TensorFlow Models in Docker Using TensorFlow Serving
No items found.
6.12.2024
Read more
  • AI Act
Potential Not Yet Fully Tapped – A Commentary on the EU’s Proposed AI Regulation
Team statworx
6.12.2024
Read more
  • Artificial Intelligence
  • Deep Learning
  • statworx
Creaition – revolutionizing the design process with machine learning
Team statworx
6.12.2024
Read more
  • Data Science
  • Deep Learning
The 5 Most Important Use Cases for Computer Vision
Team statworx
6.12.2024
Read more
  • Artificial Intelligence
  • Data Science
  • Machine Learning

Generative Adversarial Networks: How Data Can Be Generated With Neural Networks
Team statworx
6.12.2024
Read more
  • Data Engineering
5 Technologies That Every Data Engineer Should Know
Team statworx
6.12.2024
Read more
This is some text inside of a div block.